How to Run a Live Service Game: The Weekly Operating System I Use

If you run a live service game, you already know that shipping a feature is the easy part. The harder part is knowing whether it worked, why it worked, and what to do next. Most live game teams struggle with that not because they lack talent or ideas, but because they lack a repeatable operating system that connects signals to decisions week over week.
Most live game teams do not have a product problem. They have an operating problem.
This post is about the system I use. I have written separately about how I run a weekly numbers review and how I define expected outcomes before shipping anything. Those are two pieces of this larger rhythm. Here I want to show how all the pieces fit together, and go deep on the part most teams skip entirely: signal detection.
The Five-Step Weekly Live Ops Rhythm
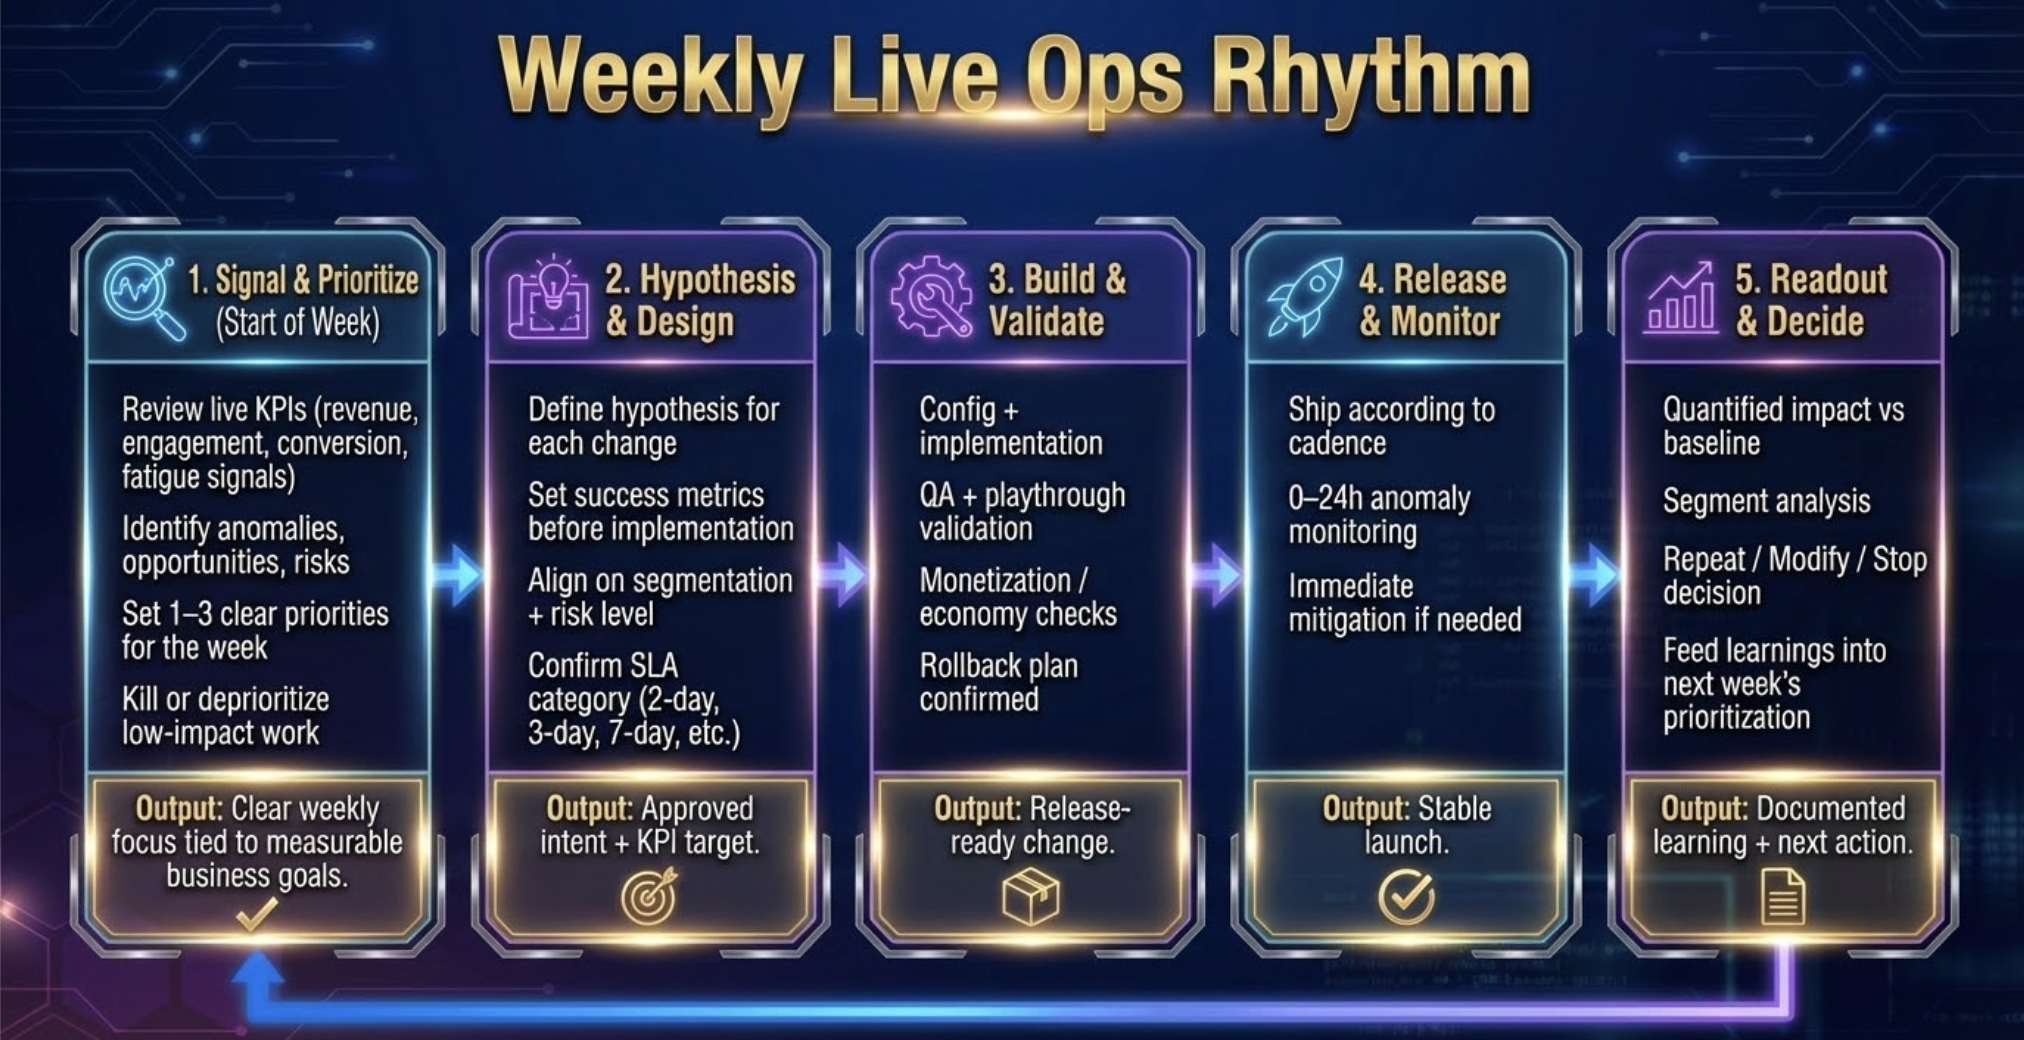
The rhythm I use has five steps. Each has a clear input, a clear output, and a clear owner. Together they form a closed loop that moves the team from data to decision without losing the thread between cycles.
Step 1: Signal and Prioritize. Review live KPIs, identify what diverged from expectation, set one to three priorities for the week. Output: clear weekly focus tied to measurable business goals.
Step 2: Hypothesis and Design. Define a hypothesis for each priority, set success metrics before implementation, confirm the SLA. Output: approved intent and KPI target. I cover this process in depth in my post on setting expected outcomes before you ship.
Step 3: Build and Validate. Implementation, QA, economy checks, rollback plan confirmed. Output: release-ready change.
Step 4: Release and Monitor. Ship according to cadence, zero to 24-hour anomaly monitoring, immediate mitigation if needed. Output: stable launch.
Step 5: Readout and Decide. Quantified impact versus baseline, Repeat/Modify/Stop decision, learnings fed into next week. Output: documented learning and next action. I cover how I structure this in my post on running a weekly numbers review.
Steps 2 through 5 each deserve their own treatment and I have covered two of them elsewhere. What I want to focus on here is Step 1, because nothing else in the rhythm works if it is done poorly.
Signal Detection: Two Jobs, Not One
This is where most teams lose the thread, because signal detection is actually doing two different jobs simultaneously and most teams treat it as one.
The first job is monitoring. Most weeks, signal detection is not about finding a new problem. It is about confirming that work already in flight is performing within range of the expected outcome you set before it shipped. You are comparing actuals against targets. That is it. If a feature launched three weeks ago and its primary metric is within 5% of the EO, signal detection for that initiative takes thirty seconds. On track. Move on.
The second job is investigation. Something has diverged enough from expectation that it warrants a closer look. This is the moment the rhythm shifts from monitoring mode into action mode. The trigger is not a judgment call. It is a threshold: more than 15% below the EO sustained over three or more days, or a guardrail breach at any magnitude. When that threshold is crossed, signal detection stops being a review and becomes an investigation.
Understanding which mode you are in at any given moment is the core discipline of Step 1. A team that treats every weekly review as an investigation is always in crisis mode. A team that never escalates from monitoring to investigation misses the problems that actually matter. The thresholds are what keep you honest about which mode applies.
Triangulating quant and qual to confirm the signal
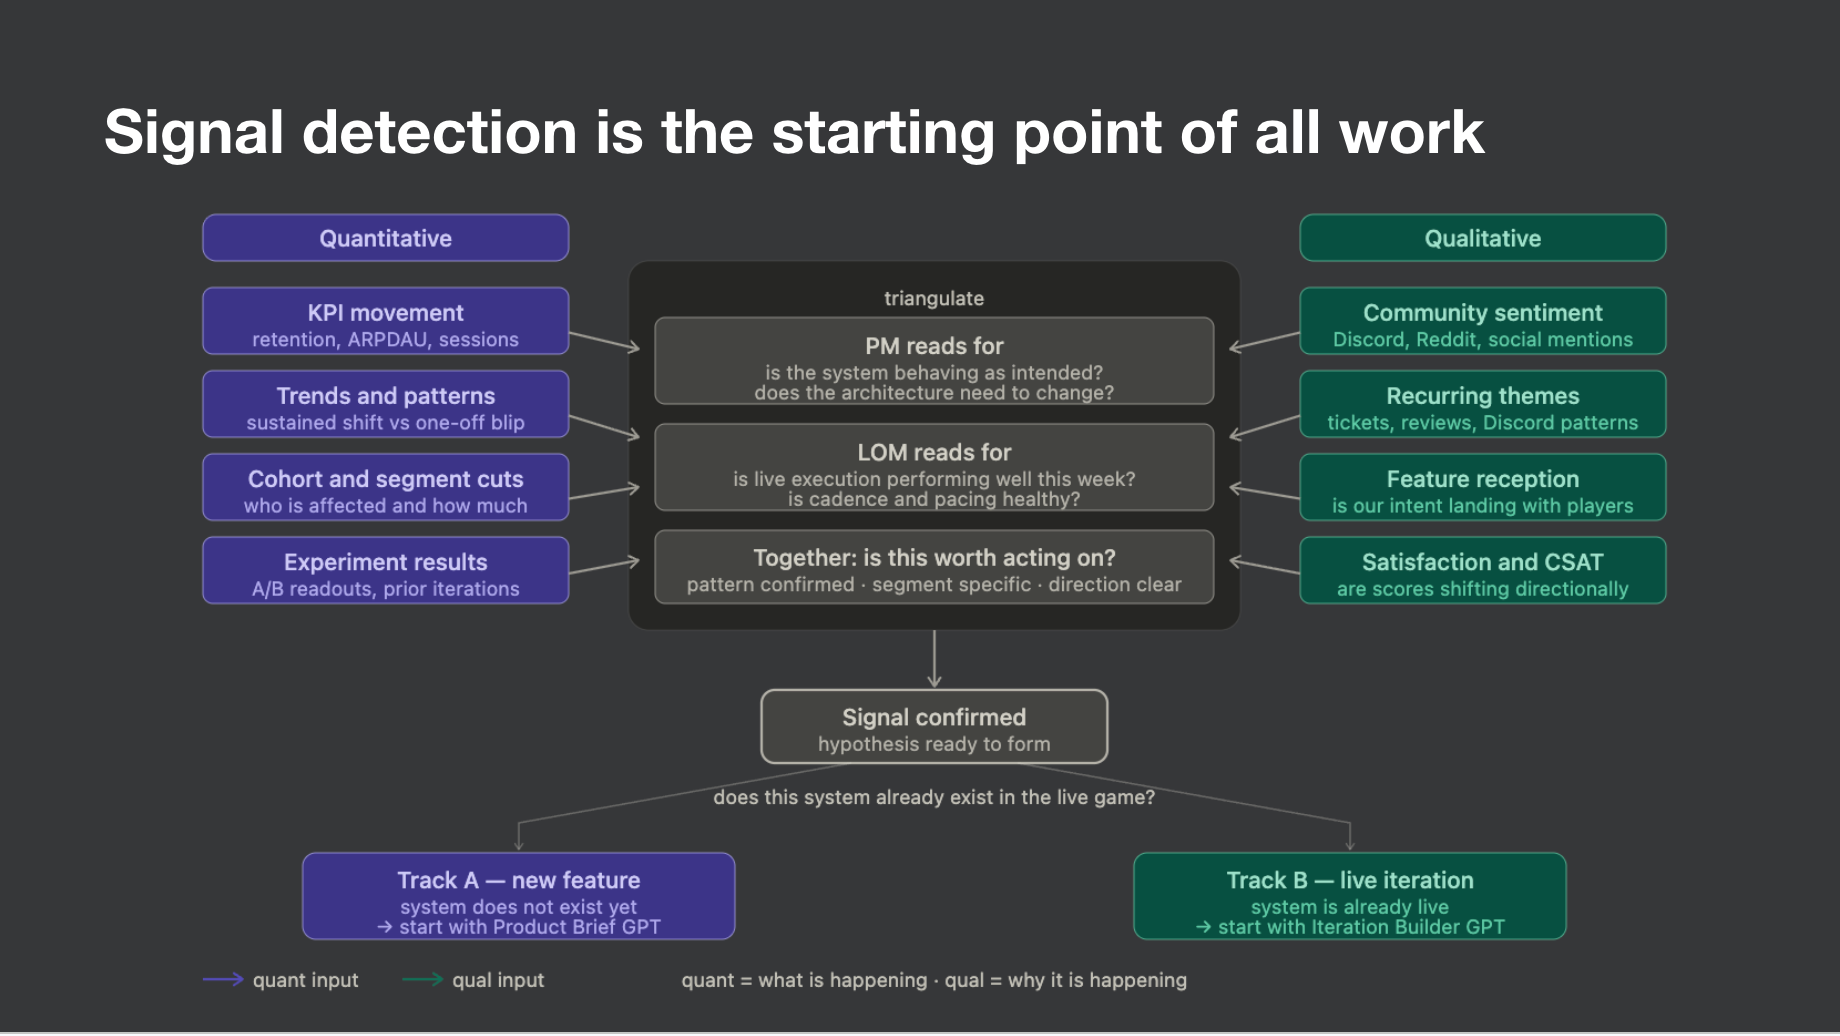
Once something crosses the threshold for investigation, the next move is triangulation. Quant tells you what is happening. Qual tells you why. Neither is sufficient on its own to confirm a signal worth acting on.
On the quant side I am looking at KPI movement against a baseline, the EO, trends and patterns that distinguish a sustained shift from a one-off blip, cohort and segment cuts to understand who is affected and how much, and experiment results from anything currently in a test window. On the qual side I pull from support tickets, community channels, and app store reviews every week. The discipline is synthesis, not comprehension. I want category distribution first: which complaint categories are up more than 20% week over week? A qual signal is confirmed when the same theme appears in three or more tickets with distinct language and shows up in at least one community source in the same seven-day window. High visibility is not high signal. Sustained volume or cross-source corroboration is.
Together, quant and qual feed a single question: is this worth acting on? Pattern confirmed, segment specific, direction clear. If the answer is yes, the signal is confirmed and hypothesis formation begins. If the answer is not yet, it goes back into monitoring. For a deeper look at how I weigh qual against quant, my post on using qualitative signals in game development covers the full framework.
Check the calendar before forming any hypothesis
Every signal exists inside a calendar context. Before I form a hypothesis I ask: what was live during the signal window, were there economy or tuning changes, is there a prior comparable period? Confusion spikes at event launches. Frustration spikes at event endings. Value perception complaints follow economy changes. If the calendar explains the signal, the response is to monitor. If it does not, I escalate to hypothesis formation immediately.
Form the hypothesis before you pull the data
This is the step most teams get backwards. They pull data first and then explain what they see. That produces rationalization, not analysis. I write two to three falsifiable hypotheses before any deep analysis begins, each mapping to a distinct cause with specific data that would confirm or reject it. The hypotheses define the data pull. Analysis not tied to a hypothesis produces noise.
Earlier this year I saw ticket volume spike roughly 25% with no calendar explanation. Before opening a single dashboard I wrote three hypotheses: a mid-game progression bottleneck, a shift in offer surfacing reducing value perception, and a returning player cohort hitting an untuned wall. The data pull took four hours. The progression hypothesis was rejected immediately. The offer surfacing hypothesis was confirmed. The returning player hypothesis was directional. We had a clear problem statement by end of day and a design brief started the following morning. Without the hypothesis step we would have been in dashboards for two days with five competing theories and no clear owner.
Classify and hand off: Track A or Track B
Once the signal is confirmed and the hypotheses are written, the final move in Step 1 is classification. The question is simple: does the system this signal points to already exist in the live game? If not, it goes to Track A, a full product brief for a new feature. If yes, it goes to Track B, a live iteration with a defined test structure. That classification is the handoff to Step 2. Without it, the design conversation starts without a frame and the rhythm breaks down.
The Failure Modes to Watch For
Starting with solutions instead of diagnosis. Revenue is down and within ten minutes the team is debating whether to run a sale. Nobody has confirmed what is driving the decline. Signal review is non-negotiable. You do not form hypotheses until the signal is confirmed.
Tracking too many metrics with no hierarchy. When everything is a primary metric, nothing is. One primary metric per initiative. One to two secondary metrics that explain it. Specific guardrail thresholds that trigger action.
Letting the roadmap override live data. A roadmap is a plan. Your operating system is how you respond when the plan breaks. The live signal has to have the authority to redirect the roadmap when the data warrants it.
This Is Not a Process. It Is a Way of Thinking.
What I have described is not a checklist. It is a way of orienting a live service team around the right questions in the right order. What is actually happening? What might be causing it? What do we do about it? Did it work? The five-step rhythm gives those questions a structure and makes sure the answer to the last one feeds the first one the following week.
Live service games do not reward teams that ship the most. They reward teams that learn the fastest. The system is what gives you something to stand on when everything else is in motion.
For a more detailed view please see my Signal Detection Guide in the Resource Hub.


